Viral dynamics in monkey and bat cell lines
Introduction
Brook et al. studied the effect of distinct immune phenotypes on cellular-scale viral propagation in three mammalian kidney cell lines with different interferon pathways (IFN). Differences in the IFN response upon pathogen invasion allowed to experimentally observe, model and numerically simulate viral dynamics in cells with
- absent,
- induced, and
- constitutive immunity.
Brook et al. also developed two related models of these processes, (1) a mean field compartmental model for within-host viral dynamics under different immunity assumptions and (2) a stochastic, spatially explicit individual-based model. The mean field model was fitted to experimental data obtained in a series of in vitro infection trials. The model results showed that stronger antiviral immune response restrains cell death allowing for an accelerated spread and longer viral presence within the host. The finding suggests a role for a pathogen reservoir in hosts with stronger immunity.
Experimental Data
Brook et al. have performed a series of infection assays on three immortalized mammalian cell lines:
- IFN-defective Vero (African green monkey) cells,
- RoNi/7.1 (Bat Rousettus aegyptiacus) cells with an induced IFN response upon infection, and
- PaKiT01 (Bat Pteropus alecto) cells that constitutively express IFN-
The three cell lines were infected with three replication competent, GFP-tagged vesicular stomatitis Indiana viruses:
- rVSV-G,
- rVSV-EBOV, and
- rVSV-MARV.
Cell entry was mediated by the glycoprotein of the bat-evolved filoviruses, Ebola (EBOV) and Marburg (MARV).
Each cell culture was infected with each virus at two multiplicities of infection (MOI): 0.0001 (low) and 0.001 (high). At the start of an infectivity assay
where
Model Description
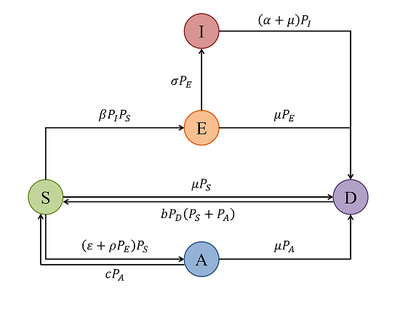
Brook et al. assumed the cells to have either of the following five states:
- susceptible (S)
- antiviral (A)
- exposed (E)
- infectious (I)
- dead (D)
The modeled viral infection and immunity processes are summarized in this state transition graph:
The attached Morpheus model is twofold, it comprises the mean field model and the spatial model, running in parallel for the same parameter set. The parameter set is taken from the publication’s Table 1 and Suppl. file 4. The added model constants termed
select.celltypeselect.virusselect.immunityMOI
allow to readily parametrize and run any of the
Mean Field Model
For the mean field model, the state of the system was described by proportions of the respective cell types, e.g.,
This resulted in the following system of ODEs:
Initial conditions are calculated (including the dependency of cell types at disease-free equilibrium DFE) exactly and individually for each combination of cell line/virus/immune type as defined in the mean field model code by Brook et al..
Spatial Model
The spatial model is a cellular automaton on a fixed two-dimensional hexagonal grid with time unit is hours post-infection and the space unit is one lattice interval corresponding to the size of a cell.
Regarding the transition from susceptible to antiviral cells, the important parameters of the model,
Transmission of the virus and the birth of new cells is computed probabilistically. The birth rate
To compensate for the difference between local interactions in the spatial model and globally averaged interactions in the mean field model, Brook et al. rescaled two parameter values for the spatial model: the
Initial conditions are copied exactly and individually for each combination of cell line/virus/immune type from the corresponding spatial model code by Brook et al..
Results
We have reproduced the graphs (and share our plotting workflow in the iPython Notebook under Downloads below) of the publication using Morpheus and based on the author’s code in the supplementary materials. To rerun or extend each of our results, go to Global in Morpheus and specify the desired cell, virus and immunity type.
Reproduction of mean field results
 ([Fig. 5](https://elifesciences.org/articles/48401#fig5)) [*CC BY 4.0*](https://creativecommons.org/licenses/by/4.0/)](https://d33wubrfki0l68.cloudfront.net/c6730cb8a881047f3b7c6c81a1e160f08e525c82/74306/media/model/m7677/paper_fig5_hufe9680b931f8fa2091a5337258d24d84_234203_2c7400fea3f679dea84af9a5aeb0f61f.png)
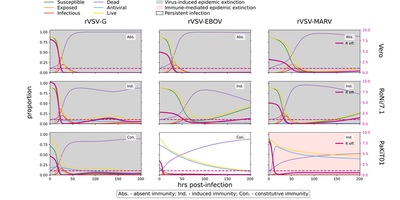
Comparing both figures above, we could reproduce the mean field model exactly, as expected for this deterministic model. Additional curves in the Morpheus graphs show the time courses of all remaining variables.
Note that the black dots in the publication’s graphs correspond to experimental data and are not included in the Morpheus graphs.
Reproduction of spatial model results
 ([Fig. 5 Suppl. 3](https://elifesciences.org/articles/48401/figures#fig5s3)). Unshaded panels correspond to best fitting immune type for each virus/cell line combination and only those are followed up in the Morpheus model below. [*CC BY 4.0*](https://creativecommons.org/licenses/by/4.0/)](https://d33wubrfki0l68.cloudfront.net/5673c22fe76cd28521ad88e58f1f5c9ed6ffbc5d/7b7db/media/model/m7677/paper_fig5suppl3_hu7d26c17bbc2d6995975f226dad45da51_807232_2ace69a971c17fe8ce57b2ae61c79d5f.png)
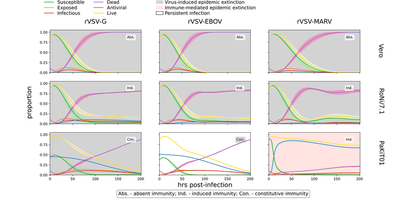
Again for the Morpheus model, all curves show time courses for individual cell types. The published spatial model results were reproduced statistically given ten simulation runs at each combination.
Note, for both above figures of published and reproduced spatial model results, two of the natural cell death rates were changed to
A representative simulation run (with
Example Simulation
This synced composite video shows the published result on top and the reproduced result in Morpheus at the bottom.
Top: Example run of the spatial model from Brook et al. with PaKiT01 cell type, rVSV-EBOV virus and constitutive immunity, published as Video 3 (CC BY 4.0).
Bottom: Example run of the spatial model in Morpheus with PaKiT01 cell type, rVSV-EBOV virus and constitutive immunity. To run this combination with the present model.xml, change the three select... constants in the Morpheus GUI from (1,1,1) to (3,2,3). As we randomly initialize
Reference
This model reproduces a published result, originally obtained with a different simulator:
C. E. Brook, M. Boots, K. Chandran, A. P. Dobson, C. Drosten, A. L. Graham, B. T. Grenfell, M. A. Müller, M. Ng, L.-F. Wang, A. van Leeuwen: Accelerated viral dynamics in bat cell lines, with implications for zoonotic emergence. eLife 9: e48401, 2020.
Model
model.xml
XML Preview
<?xml version='1.0' encoding='UTF-8'?>
<MorpheusModel version="4">
<Description>
<Details>Full title: Viral dynamics in monkey and bat cell lines
Date: 15.06.2022
Authors: Cara E Brook, Mike Boots, Kartik Chandran, Andrew P Dobson, Christian Drosten, Andrea L Graham, Bryan T Grenfell, Marcel A Müller, Melinda Ng, Lin-Fa Wang, Anieke van Leeuwen
Contributors: Chetan Munegowda, Madina Japakhova, Shanya Singhal, Justin Bürger, Cara E Brook, Lutz Brusch
Software: Morpheus (open-source), download from https://morpheus.gitlab.io
Time unit: hours post infection
Space unit: lattice interval corresponds to cell size
ModelID: https://identifiers.org/morpheus/M7677
Reference: This model reproduces the results in this publication which were originally obtained with a different simulator:
Brook et al. (2020) Accelerated viral dynamics in bat cell lines, with implications for zoonotic emergence. eLife 9:e48401.
https://doi.org/10.7554/eLife.48401</Details>
<Title>Viral Dynamics</Title>
</Description>
<Space>
<Lattice class="hexagonal">
<Neighborhood>
<Order>5</Order>
</Neighborhood>
<Size symbol="size" value="110, 127, 0"/>
<BoundaryConditions>
<Condition type="periodic" boundary="x"/>
<Condition type="constant" boundary="y"/>
</BoundaryConditions>
</Lattice>
<SpaceSymbol symbol="space"/>
</Space>
<Time>
<StartTime value="0"/>
<StopTime value="200"/>
<TimeSymbol symbol="time" name="Time [hours post infection]"/>
<RandomSeed value="0"/>
</Time>
<CellTypes>
<CellType name="infectious" class="biological">
<ChangeCellType newCellType="dead" name="Natural death of infectious cells" time-step="dt">
<Condition>time > (t_birth+tau_mu)</Condition>
<Triggers>
<Rule symbol-ref="t_start">
<Expression>time</Expression>
</Rule>
</Triggers>
</ChangeCellType>
<ChangeCellType newCellType="dead" name="Death of infectious cells due to lysis" time-step="dt">
<Condition>time > (t_start+tau_alpha)</Condition>
<Triggers>
<Rule symbol-ref="t_start">
<Expression>time</Expression>
</Rule>
</Triggers>
</ChangeCellType>
<Property symbol="tau_mu" value="rand_norm(1/mu,1/mu/2)"/>
<Property symbol="tau_alpha" value="rand_norm(1/alpha,1/alpha/4)"/>
<Property symbol="t_start" value="0.0"/>
<Property symbol="t_birth" value="0.0"/>
</CellType>
<CellType name="dead" class="biological">
<Property symbol="cDS" value="0.0" name="cDS"/>
<Property symbol="cDA" value="0.0" name="cDA"/>
<Property symbol="cSS" value="0.0" name="cSS"/>
<NeighborhoodReporter name="cDS" time-step="dt">
<Input value="(sqrt((cell.center.x-local.cell.center.x)^2+(cell.center.y-local.cell.center.y)^2)<1.5)*(cell.type == celltype.susceptible.id)/6" scaling="cell" noflux-cell-medium="false"/>
<Output mapping="sum" symbol-ref="cDS"/>
</NeighborhoodReporter>
<NeighborhoodReporter name="cDA" time-step="dt">
<Input value="(sqrt((cell.center.x-local.cell.center.x)^2+(cell.center.y-local.cell.center.y)^2)<1.5)*(cell.type == celltype.antiviral.id)/6" scaling="cell" noflux-cell-medium="false"/>
<Output mapping="sum" symbol-ref="cDA"/>
</NeighborhoodReporter>
<NeighborhoodReporter name="cSS" time-step="dt">
<Input value="cell.type == celltype.susceptible.id" scaling="cell" noflux-cell-medium="false"/>
<Output mapping="average" symbol-ref="cSS"/>
</NeighborhoodReporter>
<ChangeCellType newCellType="susceptible" name="Regeneration of dead cells because of antiviral neighbour cells" time-step="dt">
<Condition>rand_uni(0,1) < (b*cDA*dt)</Condition>
<Triggers>
<Rule symbol-ref="t_start">
<Expression>time</Expression>
</Rule>
<Rule symbol-ref="tau_mu">
<Expression>rand_norm(1/mu,1/mu/2)</Expression>
</Rule>
<Rule symbol-ref="tau_epsilon">
<Expression>if((epsilon*cSS)>0,rand_norm(1/(epsilon*cSS),1/(epsilon*cSS)/4),100000000000)</Expression>
</Rule>
<Rule symbol-ref="t_birth">
<Expression>time</Expression>
</Rule>
</Triggers>
</ChangeCellType>
<ChangeCellType newCellType="susceptible" name="Regeneration of dead cells because of susceptible neighbour cells" time-step="dt">
<Condition>rand_uni(0,1) < (b*cDS*dt)</Condition>
<Triggers>
<Rule symbol-ref="t_start">
<Expression>time</Expression>
</Rule>
<Rule symbol-ref="tau_mu">
<Expression>rand_norm(1/mu,1/mu/2)</Expression>
</Rule>
<Rule symbol-ref="tau_epsilon">
<Expression>if((epsilon*cSS)>0,rand_norm(1/(epsilon*cSS),1/(epsilon*cSS)/4),100000000000)</Expression>
</Rule>
<Rule symbol-ref="t_birth">
<Expression>time</Expression>
</Rule>
</Triggers>
</ChangeCellType>
<Property symbol="t_start" value="0.0"/>
</CellType>
<CellType name="exposed" class="biological">
<ChangeCellType newCellType="dead" name="Natural death of exposed cells" time-step="dt">
<Condition>time > (t_birth+tau_mu)</Condition>
<Triggers>
<Rule symbol-ref="t_start">
<Expression>time</Expression>
</Rule>
</Triggers>
</ChangeCellType>
<ChangeCellType newCellType="infectious" name="Exposed cells become infectious" time-step="dt">
<Condition>time > (t_start+tau_sigma)</Condition>
<Triggers>
<Rule symbol-ref="t_start">
<Expression>time</Expression>
</Rule>
<Rule symbol-ref="tau_mu">
<Expression>rand_norm(1/mu,1/mu/2)</Expression>
</Rule>
<Rule symbol-ref="tau_alpha">
<Expression>rand_norm(1/alpha,1/alpha/4)</Expression>
</Rule>
</Triggers>
</ChangeCellType>
<Property symbol="tau_sigma" value="rand_norm(1/sigma,1/sigma/4)"/>
<Property symbol="tau_mu" value="rand_norm(1/mu,1/mu/2)"/>
<Property symbol="t_start" value="0.0"/>
<Property symbol="t_birth" value="0.0"/>
</CellType>
<CellType name="susceptible" class="biological">
<Property symbol="cSI" value="0.0" name="cSI"/>
<Property symbol="cSS" value="0.0" name="cSS"/>
<Variable symbol="cSE" value="0.0" name="cSE"/>
<NeighborhoodReporter name="cSI" time-step="dt">
<Input value="cell.type == celltype.infectious.id" scaling="cell" noflux-cell-medium="false"/>
<Output mapping="average" symbol-ref="cSI"/>
</NeighborhoodReporter>
<NeighborhoodReporter name="cSE" time-step="dt">
<Input value="cell.type == celltype.exposed.id" scaling="cell" noflux-cell-medium="false"/>
<Output mapping="average" symbol-ref="cSE"/>
</NeighborhoodReporter>
<NeighborhoodReporter name="cSS" time-step="dt">
<Input value="cell.type == celltype.susceptible.id" scaling="cell" noflux-cell-medium="false"/>
<Output mapping="average" symbol-ref="cSS"/>
</NeighborhoodReporter>
<ChangeCellType newCellType="dead" name="Natural death of susceptible cells" time-step="dt">
<Condition>time > (t_birth+tau_mu)</Condition>
<Triggers>
<Rule symbol-ref="t_start">
<Expression>time</Expression>
</Rule>
</Triggers>
</ChangeCellType>
<ChangeCellType newCellType="antiviral" name="Susceptible cells acquire induced immunity" time-step="dt">
<Condition>rand_uni(0,1) < (rho*cSE*dt)</Condition>
<Triggers>
<Rule symbol-ref="t_start">
<Expression>time</Expression>
</Rule>
<Rule symbol-ref="tau_mu">
<Expression>rand_norm(1/mu,1/mu/2)</Expression>
</Rule>
</Triggers>
</ChangeCellType>
<ChangeCellType newCellType="antiviral" name="Susceptible cells acquire constitutive immunity" time-step="dt">
<Condition>time > (t_start+tau_epsilon)</Condition>
<Triggers>
<Rule symbol-ref="t_start">
<Expression>time</Expression>
</Rule>
<Rule symbol-ref="tau_mu">
<Expression>rand_norm(1/mu,1/mu/2)</Expression>
</Rule>
</Triggers>
</ChangeCellType>
<ChangeCellType newCellType="exposed" name="Susceptible cells gets exposed to the pathogen" time-step="dt">
<Condition>rand_uni(0,1) < (beta*cSI*dt)</Condition>
<Triggers>
<Rule symbol-ref="t_start">
<Expression>time</Expression>
</Rule>
<Rule symbol-ref="tau_mu">
<Expression>rand_norm(1/mu,1/mu/2)</Expression>
</Rule>
<Rule symbol-ref="tau_sigma">
<Expression>rand_norm(1/sigma,1/sigma/4)</Expression>
</Rule>
</Triggers>
</ChangeCellType>
<Property symbol="tau_mu" value="rand_norm(1/mu,1/mu/2)"/>
<Property symbol="tau_epsilon" value="if((epsilon*cSS)>0,rand_norm(1/(epsilon*cSS),1/(epsilon*cSS*4)),100000000000)"/>
<Property symbol="t_start" value="0.0"/>
<Property symbol="t_birth" value="0.0"/>
</CellType>
<CellType name="antiviral" class="biological">
<ChangeCellType newCellType="dead" name="Natural death of antiviral cells" time-step="dt">
<Condition>time > (t_birth+tau_mu)</Condition>
<Triggers>
<Rule symbol-ref="t_start">
<Expression>time</Expression>
</Rule>
</Triggers>
</ChangeCellType>
<ChangeCellType newCellType="susceptible" name="Antiviral cells become susceptible" time-step="dt">
<Condition>rand_uni(0,1) < c*dt</Condition>
<Triggers>
<Rule symbol-ref="t_start">
<Expression>time</Expression>
</Rule>
<Rule symbol-ref="tau_mu">
<Expression>rand_norm(1/mu,1/mu/2)</Expression>
</Rule>
<Rule symbol-ref="tau_epsilon">
<Expression>if(epsilon>0,rand_norm(1/epsilon,1/epsilon/4),100000000000)</Expression>
</Rule>
</Triggers>
</ChangeCellType>
<Property symbol="tau_mu" value="rand_norm(1/mu,1/mu/2)"/>
<Property symbol="t_start" value="0.0"/>
<Property symbol="t_birth" value="0.0"/>
</CellType>
<CellType name="medium" class="medium"/>
</CellTypes>
<CellPopulations>
<Population name="infectious" type="infectious" size="0">
<InitCircle mode="random" number-of-cells="0">
<Dimensions radius="52.0" center="75.0, 75.0, 0.0"/>
</InitCircle>
</Population>
<Population name="exposed" type="exposed" size="0">
<InitCircle mode="random" number-of-cells="(MOI==0.001)*10">
<Dimensions radius="52.0" center="55.0, 55.0, 0.0"/>
</InitCircle>
</Population>
<Population name="dead" type="dead" size="0">
<InitCircle mode="random" number-of-cells="(MOI==0.001)*953">
<Dimensions radius="52.0" center="55.0, 55.0, 0.0"/>
</InitCircle>
</Population>
<Population name="susceptible" type="susceptible" size="0">
<InitCircle mode="random" number-of-cells="(MOI==0.001)*(9037+(select.celltype==3)*(select.virus==1)*(select.immunity==3)*(-4786)+(select.celltype==3)*(select.virus==2)*(select.immunity==3)*(-5351))">
<Dimensions radius="52.0" center="55.0, 55.0, 0.0"/>
</InitCircle>
</Population>
<Population name="antiviral" type="antiviral" size="0">
<InitCircle mode="random" number-of-cells="(MOI==0.001)*(0+(select.celltype==3)*(select.virus==1)*(select.immunity==3)*4786+(select.celltype==3)*(select.virus==2)*(select.immunity==3)*5351)">
<Dimensions radius="52.0" center="55.0, 55.0, 0.0"/>
</InitCircle>
</Population>
<Population name="susceptible" type="susceptible" size="0">
<InitCircle name="filling up space with susceptible cells for above conditions" mode="random" number-of-cells="(MOI==0.001)*((select.celltype!=3)*(select.virus!=2)*(select.immunity!=3)*100000)">
<Dimensions radius="52.0" center="55.0, 55.0, 0.0"/>
</InitCircle>
</Population>
<Population name="antiviral" type="antiviral" size="0">
<InitCircle name="filling up space with antiviral cells for above conditions" mode="random" number-of-cells="(MOI==0.001)*((select.celltype==3)*(select.virus==2)*(select.immunity==3)*100000)">
<Dimensions radius="52.0" center="55.0, 55.0, 0.0"/>
</InitCircle>
</Population>
</CellPopulations>
<Global>
<Constant symbol="select.celltype" value="1" name="1=Vero, 2=RoNi7.1, 3=PaKiT01"/>
<Constant symbol="select.virus" value="1" name="1=rVSV-G, 2=rVSV-EBOV, 3=rVSV-MARV"/>
<Constant symbol="select.immunity" value="1" name="1=absent, 2=induced, 3=constitutive"/>
<Constant symbol="MOI" value="0.001" name="Initial infectious dose"/>
<Constant symbol="epsilon" value="(select.celltype==3)*(select.virus==1)*(select.immunity==3)*0.006017893 + (select.celltype==3)*(select.virus==2)*(select.immunity==3)*0.04775666"/>
<Constant symbol="rho" value="(select.celltype==2)*(select.virus==1)*(select.immunity==2)*0.088973822 + (select.celltype==2)*(select.virus==2)*(select.immunity==2)*0.036294543 + (select.celltype==2)*(select.virus==3)*(select.immunity==2)*0.017664985 + (select.celltype==3)*(select.virus==1)*(select.immunity==3)*8.25891E-08 + (select.celltype==3)*(select.virus==2)*(select.immunity==3)*4.46435E-08 + (select.celltype==3)*(select.virus==3)*(select.immunity==2)*13.14416159"/>
<Constant symbol="mu" value="(select.celltype==1)*(1/121) + (select.celltype==2)*(1/191) + (select.celltype==3)*(1/84)">
<Annotation>To reproduce the originally published Fig. 5 Suppl. 3, use mu=
(select.celltype==1)*(1/83) + (select.celltype==2)*(1/191) + (select.celltype==3)*(1/120)
as in the originally published simulation code.</Annotation>
</Constant>
<Constant symbol="mu_MF" value="(select.celltype==1)*(1/121) + (select.celltype==2)*(1/191) + (select.celltype==3)*(1/84)"/>
<Constant symbol="alpha" value="1/6"/>
<Constant symbol="beta_MF" value="(MOI==0.001)*((select.celltype==1)*(select.virus==1)*(select.immunity==1)*2.441842792 + (select.celltype==1)*(select.virus==2)*(select.immunity==1)*1.499584278 + (select.celltype==1)*(select.virus==3)*(select.immunity==1)*0.975158825 + (select.celltype==2)*(select.virus==1)*(select.immunity==2)*2.470464175 + (select.celltype==2)*(select.virus==2)*(select.immunity==2)*0.684901882 + (select.celltype==2)*(select.virus==3)*(select.immunity==2)*1.233417847 + (select.celltype==3)*(select.virus==1)*(select.immunity==3)*3.451642437 + (select.celltype==3)*(select.virus==2)*(select.immunity==3)*34.48214995 + (select.celltype==3)*(select.virus==3)*(select.immunity==2)*3.24521928)"/>
<Constant symbol="beta" value="beta_MF*10"/>
<Constant symbol="b_MF" value="0.025"/>
<Constant symbol="b" value="b_MF*6"/>
<Constant symbol="c" value="0"/>
<Constant symbol="sigma" value="(select.celltype==1)*(select.virus==1)*(select.immunity==1)*0.119284294 + (select.celltype==1)*(select.virus==2)*(select.immunity==1)*0.141509434 + (select.celltype==1)*(select.virus==3)*(select.immunity==1)*0.104347826 + (select.celltype==2)*(select.virus==1)*(select.immunity==2)*0.125 + (select.celltype==2)*(select.virus==2)*(select.immunity==2)*0.148883375 + (select.celltype==2)*(select.virus==3)*(select.immunity==2)*0.147420147 + (select.celltype==3)*(select.virus==1)*(select.immunity==3)*0.139534884 + (select.celltype==3)*(select.virus==2)*(select.immunity==3)*0.165745856 + (select.celltype==3)*(select.virus==3)*(select.immunity==2)*0.155844156"/>
<Constant symbol="N_total" value="10000" name="total number of cells required"/>
<Function symbol="N" name="total number of cells">
<Expression>celltype.antiviral.size+celltype.dead.size+celltype.exposed.size+celltype.infectious.size+celltype.susceptible.size</Expression>
</Function>
<Function symbol="N_SAE" name="total number of live, uninfectious cells">
<Expression>celltype.antiviral.size+celltype.exposed.size+celltype.susceptible.size</Expression>
</Function>
<Constant symbol="dt" value="1/6" name="dt"/>
<System solver="Dormand-Prince [adaptive, O(5)]" time-step="1/6">
<DiffEqn symbol-ref="P_S">
<Expression>b_MF*P_D*(P_S+P_A)-beta_MF*P_S*P_I-mu_MF*P_S-rho*P_E*P_S-epsilon*P_S+c*P_A</Expression>
</DiffEqn>
<DiffEqn symbol-ref="P_A">
<Expression>rho*P_E*P_S+epsilon*P_S-c*P_A-mu_MF*P_A</Expression>
</DiffEqn>
<DiffEqn symbol-ref="P_E">
<Expression>beta_MF*P_S*P_I-sigma*P_E-mu_MF*P_E</Expression>
</DiffEqn>
<DiffEqn symbol-ref="P_I">
<Expression>sigma*P_E-alpha*P_I-mu_MF*P_I</Expression>
</DiffEqn>
<DiffEqn symbol-ref="P_D">
<Expression>mu_MF*(P_S+P_E+P_I+P_A)+alpha*P_I-b_MF*P_D*(P_S+P_A)</Expression>
</DiffEqn>
</System>
<Variable symbol="P_I" value="0" name="P_I"/>
<Variable symbol="P_E" value="(1-exp(-MOI))*0.9" name="P_E"/>
<Variable symbol="P_D" value="0.1" name="P_D"/>
<Variable symbol="P_S_DFE" value="((b_MF-mu_MF)*(c+mu_MF))/(b_MF*(c+mu_MF+epsilon))" name="P_S_DFE"/>
<Variable symbol="P_A_DFE" value="epsilon*P_S_DFE/(c+mu_MF)" name="P_A_DFE"/>
<Variable symbol="P_S" value="(epsilon==0)*(1-P_E-P_D)+(epsilon>0)*(P_S_DFE < P_A_DFE)*((0.9-(1-exp(-MOI)))/(1+P_A_DFE/P_S_DFE))+(epsilon>0)*(P_S_DFE >= P_A_DFE)*(1-P_E-P_A_DFE-P_D)" name="P_S"/>
<Variable symbol="P_A" value="(epsilon==0)*(0)+(epsilon>0)*(P_S_DFE < P_A_DFE)*((0.9-(1-exp(-MOI))) - P_S)+(epsilon>0)*(P_S_DFE >= P_A_DFE)*(P_A_DFE)" name="P_A"/>
<Function symbol="P_total">
<Expression>P_S+P_A+P_E+P_I+P_D</Expression>
</Function>
<Function symbol="P_SAE">
<Expression>P_S+P_A+P_E</Expression>
</Function>
<Function symbol="R0_MF" name="reproduction number">
<Expression>(beta_MF*sigma*(b_MF-mu_MF)*(c+mu_MF))/(b_MF*(sigma+mu_MF)*(alpha+mu_MF)*(c+mu_MF+epsilon)) </Expression>
</Function>
<Function symbol="R_eff_MF" name="effective reproduction number">
<Expression>R0_MF * P_S</Expression>
</Function>
<Constant symbol="antiviral_rate" value="rho*P_E*P_S-epsilon*P_S"/>
<Constant symbol="plot_helper" value="-1" name="plot_helper"/>
</Global>
<Analysis>
<Gnuplotter time-step="1">
<Plot title="A. Cell space">
<Cells value="cell.type">
<ColorMap>
<Color value="0" color="red"/>
<Color value="1" color="dark-violet"/>
<Color value="2" color="orange"/>
<Color value="3" color="dark-green"/>
<Color value="4" color="skyblue"/>
<Color value="5" color="white"/>
</ColorMap>
</Cells>
</Plot>
<Terminal name="png"/>
</Gnuplotter>
<Logger time-step="dt">
<Input>
<Symbol symbol-ref="antiviral_rate"/>
<Symbol symbol-ref="R0_MF"/>
</Input>
<Output>
<TextOutput/>
</Output>
<Plots>
<Plot time-step="1" title="B. Time series">
<Style style="points" decorate="false"/>
<Terminal terminal="png"/>
<X-axis maximum="200" minimum="0">
<Symbol symbol-ref="time"/>
</X-axis>
<Y-axis maximum="10000" minimum="0">
<Symbol symbol-ref="celltype.dead.size"/>
<Symbol symbol-ref="celltype.susceptible.size"/>
<Symbol symbol-ref="celltype.antiviral.size"/>
<Symbol symbol-ref="celltype.exposed.size"/>
<Symbol symbol-ref="N_SAE"/>
<Symbol symbol-ref="plot_helper"/>
<Symbol symbol-ref="celltype.infectious.size"/>
</Y-axis>
</Plot>
<Plot>
<Style style="points" decorate="true"/>
<Terminal terminal="png"/>
<X-axis>
<Symbol symbol-ref="time"/>
</X-axis>
<Y-axis>
<Symbol symbol-ref="P_D"/>
<Symbol symbol-ref="P_S"/>
<Symbol symbol-ref="P_A"/>
<Symbol symbol-ref="P_E"/>
<Symbol symbol-ref="P_SAE"/>
<Symbol symbol-ref="R_eff_MF"/>
<Symbol symbol-ref="P_I"/>
</Y-axis>
</Plot>
</Plots>
</Logger>
<ModelGraph format="svg" include-tags="#untagged" reduced="false"/>
</Analysis>
</MorpheusModel>

Downloads
Files associated with this model: